Abstract
Dementia is a major health concern in the aging population, with the number of people living with dementia expected to increase. Quantitative MRI techniques can offer information about microstructural changes in the brain, making them valuable tools to study and diagnose these diseases. This work studied the sensitivity of advanced diffusion MRI metrics obtained from b-tensor encoding (microscopic fractional anisotropy; isotropic kurtosis) to the microstructural changes of Alzheimer’s disease, frontotemporal dementia, and Lewy body dementia. We complemented diffusion MRI with volumetric assessments and magnetization transfer MRI, which is sensitive to myelin, and focused on multiple gray matter regions known to be affected by these diseases. We performed an additional analysis in the hippocampus at the subfield level, given its central role in Alzheimer’s disease, where certain subfields are known to be more strongly affected than others. We showed that the multidimensional space spanned by these metrics has distinct patterns for Alzheimer’s disease and frontotemporal dementia compared to healthy controls, with microscopic fractional anisotropy contributing to differences between groups, particularly in the hippocampus. Accordingly, microscopic fractional anisotropy has the potential to complement other imaging markers of neurodegeneration in the study of dementia.
Introduction
Dementia is a major health concern in the aging population, and the number of people affected is expected to increase Breijyeh & Karaman, 2020. In the early stages of dementia, cellular changes in the brain precede volumetric losses and the manifestation of cognitive decline Weston et al., 2015Jack et al., 2010. Different dementias, such as Alzheimer’s disease (AD), frontotemporal dementia (FTD), and Lewy body dementia (LBD), show spatially different patterns of atrophy, the underpinnings of which are not fully understood. Post-mortem brain histological studies have revealed hallmark cellular microstructural alterations of these disorders, such as amyloid-β plaque deposition and neurofibrillary tangle accumulation accompanied by neuronal and synaptic loss in AD, neuronal loss and gliosis associated with tau or TDP-43 inclusions in FTD, and Lewy bodies accompanied by neuronal and synaptic loss in LBD Serrano-Pozo et al., 2011Mackenzie & Neumann, 2016Sekiya et al., 2025Zetterberg & Bendlin, 2026. Despite their distinct molecular underpinnings, these disorders share several microstructural neurodegenerative changes: neuronal and neurite loss, synaptic degeneration, and reactive astrogliosis/microgliosis. Accordingly, the in vivo quantification of these alterations, particularly using sensitive neuroimaging biomarkers, could help with earlier diagnosis or support other dementia biomarkers Zetterberg & Bendlin, 2026. Moreover, the clinical presentations of these dementias often overlap, and knowledge of the spatial distribution of neurodegeneration and of the differences between dementias, especially in the earlier stages, could provide insight into microstructural alterations before cognitive decline.
Diffusion-weighted MRI (dMRI) Le Bihan et al., 1986 is a technology sensitive to microstructural cellular properties. dMRI indirectly infers cellular information by measuring the random molecular motion of water, which is hindered by cellular membranes Beaulieu, 2002. It is highly sensitive to microstructural alterations produced by neurodegeneration Afzali et al., 2021Concha, 2014, and is widely applied clinically to assess stroke and detect tumors Drake-Pérez et al., 2018. The majority of dMRI research has used diffusion tensor imaging (DTI) Basser et al., 1994 to quantify microstructural changes. DTI provides metrics such as mean diffusivity (MD), which quantifies average diffusivity, and fractional anisotropy (FA), which quantifies the degree of directional water diffusion per voxel. An MD increase could be explained by a general loss of microstructure, while FA increases with the coherence of aligned axon bundles. In AD Chen et al., 2023Acosta-Cabronero & Nestor, 2014Ashford et al., 2011Naggara et al., 2006Weston et al., 2015, FTD Gordon et al., 2016Mahoney et al., 2015 and LBD Laurell et al., 2025, observations typically include MD increases across gray and white matter, and FA decreases in white matter (suggesting degradation of axon tracts). dMRI studies comparing dementia subtypes have identified overlapping but also disease-specific white matter tract signatures Tian & Whitwell, 2026. FTD typically affects anterior tracts, while AD shows a posterior and temporal pattern Zhang et al., 2009Elahi et al., 2017. AD has also shown more widespread cortical diffusivity increases than LBD, while LBD has shown distinct amygdala and inferior longitudinal fasciculus changes Kantarci et al., 2010. However, the intrinsic limitations of DTI metrics make them unreliable in regions of dispersed cellular orientation Novikov et al., 2019Karat et al., 2024, which makes it difficult to identify the specific cellular origin of the reported changes. For example, FA is reduced where axon bundles have low orientation coherence, regardless of tissue health, such as in regions with crossing white matter fibers. Similarly, FA is limited for studying gray matter structures where fiber microstructure (e.g., axons and dendrites) is arranged in complex ways or in multiple directions within a voxel.
Recent developments in dMRI have yielded the “b-tensor encoding” acquisition Westin et al., 2016. These acquisitions collect complementary diffusion-weighted scans that encode along multiple directions simultaneously (e.g., “planar” or “spherical tensor encoding”) in addition to the conventional approach of sensitizing the signal to diffusion along a single direction at a time (“linear tensor encoding”). This broader diffusion encoding space can be used to calculate metrics that overcome some of the limitations of DTI metrics; for example, microscopic fractional anisotropy (µFA) quantifies cellular anisotropy irrespective of the sub-voxel orientation coherence (unlike FA) Lasič et al., 2014Westin et al., 2016Arezza et al., 2021Shemesh et al., 2016, and isotropic kurtosis (Ki) quantifies the variance of the compartment-specific diffusivities in a voxel, which may correlate with cell size heterogeneity Szczepankiewicz et al., 2016. µFA and Ki provide additional microstructure information that may be better suited to quantify gray matter Arezza et al., 2024Yoo et al., 2022 and cortical regions Lampinen et al., 2020. To date, b-tensor encoding has been used to study white matter microstructural changes in stroke Zhou et al., 2024 and multiple sclerosis Andersen et al., 2020, hippocampal and cortical changes in epilepsy Arezza et al., 2024Lampinen et al., 2020, and brain tumors Szczepankiewicz et al., 2016Nilsson et al., 2020. One study found that µFA reductions in the frontal cortex and the splenium of the corpus callosum correlate with increased severity of motor impairment in Parkinson’s disease Kamiya et al., 2020. However, no studies have examined µFA and Ki in the common neurodegenerative dementias, including AD, FTD, and LBD, or compared them across these dementias Afzali et al., 2022Syed Nasser et al., 2022.
This preliminary study investigated advanced dMRI metrics (µFA, Ki) in conjunction with standard dMRI metrics (FA, MD) and volumetric measures in brain regions that are commonly affected across AD, FTD, and LBD, including the frontal, parietal, temporal, cingulate, occipital and insular cortices, the amygdala and the hippocampus Naggara et al., 2006Finger, 2016Gordon et al., 2016Laurell et al., 2025Karat et al., 2025Wearn et al., 2025. To complement the dMRI metrics, we also acquired magnetization transfer saturation (MTsat) Helms et al., 2008, which is sensitive to myelin content Wood & Malik, 2020 and has been reported to decrease in dementia Moallemian et al., 2023Wearn et al., 2025. We focused on AD, FTD, and LBD, as they are the most common forms of dementia resulting from primary neurodegenerative cascades. We hypothesized that these metrics would show distinct regional profiles for each dementia, with the greatest reductions in µFA in regions affected earliest in each neurodegenerative dementia, including the parietal lobes and hippocampus, in particular the subiculum and cornu ammonis field 1 (CA1) in AD, the amygdala and occipital regions in LBD, and the frontoinsular and anterior cingulate regions in FTD.
Methods
Participants
From December 2020 to July 2025, the Cognitive Neurology and Alzheimer Research Centre at Parkwood Hospital in London, Ontario, Canada, recruited participants with neurodegenerative dementia and age-matched healthy controls (HC) into the HYADES study. Participants with neurodegenerative dementias included those with AD, FTD, or LBD.
Western University’s Health Sciences Research Ethics Board approved the study procedures. Participants, or their substitute decision makers, and their study partners (applicable only to participants with neurodegenerative dementia), provided written informed consent prior to undertaking study procedures.
Inclusion criteria for participants with neurodegenerative dementias included 1) age 30 to 90 years and 2) a clinical diagnosis of dementia based on the relevant diagnostic criteria for AD DeKosky et al., 2011, FTD Gorno-Tempini et al., 2011Rascovsky et al., 2011, and LBD McKeith et al., 2017; all participants in the LBD group met the consensus criteria for dementia with Lewy bodies, and participants with Parkinson’s disease dementia were not included. Exclusion criteria were 1) history of significant brain tumor, other neurological diseases affecting cognition, or mixed dementias, 2) cognitive or language impairment that prevented the participant from understanding the nature of the study or the study task instructions, and 3) lack of a study partner or caregiver available to provide collateral history regarding the participant’s general functioning and symptoms.
Inclusion criteria for HC participants included 1) age 30 to 90 years, 2) no reported persistent decline in cognitive capacity compared with their usual baseline, and 3) a score on the Montreal Cognitive Assessment (MoCA) of 24 or greater. Exclusion criteria were a history of a significant brain tumor, or neurological or psychiatric disease judged by the investigators to have affected cognition, including FTD, AD, LBD, or related disorders.
MRI
Acquisition protocol
The MRI acquisition was performed on a Siemens Prisma 3 T scanner with a 32-channel head coil at the Centre for Functional and Metabolic Mapping at Western University in London, ON, Canada. The protocol consisted of two anatomical acquisitions, a three-part acquisition for MTsat, and a b-tensor encoding dMRI acquisition.
The anatomical acquisitions included a T1-weighted (T1w) image acquired using a magnetization-prepared rapid acquisition gradient echo (MPRAGE) sequence (TR = 2400 ms, TE = 2.28 ms, flip angle = 8°, acquisition time = 6 min 38 s) and a T2-weighted (T2w) sequence (TR = 3200 ms, TE = 564 ms, acquisition time = 5 min 57 s). Both scans had a field of view (FOV) of 240 × 256 mm2, 0.8 mm isotropic voxel size, and generalized autocalibrating partially parallel acquisitions (GRAPPA) with an acceleration factor of 2.
The MTsat protocol included three fast low angle shot (FLASH) 3D acquisitions that had a combined scan time of 5 min 40 s: a proton density-weighted (TR = 360 ms, flip angle = 10°), a magnetization transfer-weighted (TR = 360 ms, flip angle = 10°, with the default vendor radiofrequency pulse for magnetization transfer weighting), and a T1-weighted acquisition (TR = 12 ms, flip angle = 20°). All three scans shared TE = 3.86 ms, FOV = 192 × 256 × 192 mm3, 2 mm isotropic voxel size, partial Fourier of 0.75, and a GRAPPA factor of 2.
The b-tensor dMRI protocol used a multiband echo-planar imaging sequence with an in-house modified diffusion gradient scheme Arezza et al., 2021. The diffusion gradient scheme consisted of linear tensor encoding acquisitions with 15 and 30 directions at b = 1 and 2 ms/µm2, respectively, and 18 and 48 spherical tensor-encoded averages at b = 1 and 2 ms/µm2, respectively. The linear and spherical tensor encoding acquisitions were interleaved with each other within one integrated scan. The protocol also included four b0 acquisitions and an additional b0 acquisition with reverse-phase encoding for field map correction. Supplementary Figure S.1 shows schematics of the diffusion waveform. The other parameters were TR = 4900 ms, TE = 92 ms, FOV = 229 × 229 mm2, 1.8 mm isotropic voxel size, partial Fourier of 0.75, multiband factor 2, GRAPPA factor 2, and total acquisition time of 11 min 50 s.
Image pre-processing
We preprocessed dMRI data using the DESIGNER pipeline (version 2.0.04) Ades-Aron et al., 2018Chen et al., 2024 with the following options: MP-PCA denoising Veraart et al., 2016, Rician bias correction Koay & Basser, 2006, partial Fourier Gibbs ringing removal Lee et al., 2021, and eddy for motion and field map correction Andersson & Sotiropoulos, 2016Tournier et al., 2019. Note that DESIGNER runs eddy independently for each b-tensor encoding shape (linear and spherical encoding).
We used SynthStrip (in FreeSurfer version 8.1.0) Hoopes et al., 2022Fischl, 2012 for automatic brain extraction of all images and greedy (version 1.3.0, https://
For whole-brain segmentation, we created a hybrid segmentation from the outputs of SIAM Valabregue et al., 2026 and SynthSeg+ (in FreeSurfer version 8.1.0) Fischl, 2012Billot et al., 2023, both applied to the raw T1w images. Although SIAM provided the most accurate overall segmentation in this cohort, it provides only a single label for total gray matter. To parcel this region further, we combined SIAM’s gray matter label with SynthSeg+’s cortical parcellation using the following algorithm: First, we relabeled all SIAM gray matter voxels that overlapped with SynthSeg+ segmentation with their corresponding SynthSeg+ label. Second, for the remaining non-overlapping voxels, we propagated the closest new label until all SIAM gray matter voxels were fully relabeled. We observed that both SIAM and SynthSeg+ misclassified cerebrospinal fluid (CSF) voxels within the ventricular region as hippocampus or amygdala in a subset of participants. We corrected these segmentation errors using the following algorithm: For each participant, we derived a participant-specific intensity threshold by computing the equal-posterior boundary between two fitted Gaussian distributions, built from local reference populations sampled within a 15 mm neighborhood of the hippocampus–amygdala mask: ventricular and sulcal CSF labels served as the CSF reference, and cortical gray matter labels from the same neighborhood served as the gray matter reference. Among hippocampus–amygdala voxels whose T1w intensity fell on the CSF side of this threshold, we relabeled only those forming a spatially contiguous region connected to pre-existing CSF labels, ensuring that isolated low-intensity voxels not physically continuous with a CSF compartment were left unchanged. We visually inspected all segmentations to confirm the validity of the correction. We implemented both algorithms in custom Python code, available in the Snakemake workflow (see Data and code availability). We used the resulting hybrid segmentation (SIAM gray matter relabeled with the SynthSeg+ cortical parcellation and corrected for hippocampus–amygdala CSF misclassification) for all whole-brain analyses.
Quantitative MRI maps
We computed µFA and Ki from the preprocessed dMRI data using the function nii2uFA_fwe in the MatMRI package (version 0.1.17) Baron et al., 2026Arezza et al., 2023. We computed FA and MD from the preprocessed linear tensor encoding images using the nii2kurt function in MatMRI with the default spatial regularization parameter of 0.5 Hamilton et al., 2024. We computed the MTsat map using the “qi mtsat” binary in the QUIT package (version 3.4) Wood, 2018. We then registered all maps to the T1w space using the image transformations calculated in the previous section.
Analyses
Whole brain
We examined eight regions of interest (ROIs) that are differentially affected in AD, FTD, and LBD: the frontal, parietal, temporal, cingulate, occipital and insular cortices, the hippocampus and the amygdala. In AD, the hippocampus, amygdala and temporal cortex are affected first, with later involvement of the parietal and posterior cingulate cortices Planche et al., 2022Whitwell et al., 2007. In FTD, the frontal, insular, anterior cingulate and anterior temporal cortices and the amygdala are characteristically affected, with parietal involvement in corticobasal syndrome Rascovsky et al., 2011Gorno-Tempini et al., 2011Planche et al., 2023Finger, 2016. In LBD, the medial temporal lobe is relatively preserved compared with AD, whereas the occipital, parietal, frontal and insular cortices are affected McKeith et al., 2017Whitwell et al., 2007Conti et al., 2025.
We combined cortical parcellation labels from the hybrid segmentation into these eight ROIs (details in the Snakemake workflow; see Data and code availability). We normalized the volume of each ROI by each participant’s total intracranial volume, which we approximated as the combined volume of all SynthSeg+ labels, and expressed it as a percentage. We then averaged each metric within each ROI across both hemispheres.
As an exploratory analysis, to obtain a high-level quantitative marker of the difference between participants with dementia and HC, we calculated the Mahalanobis distance (MhD) Mahalanobis, 2018 for each participant and ROI. The MhD measures the multivariate distance of an individual from a distribution while accounting for the covariance between features Tremblay et al., 2024. Here, for each ROI, we calculated the MhD of each participant (including HC) from the distribution of the control group, using the six metrics in the study (FA, MD, µFA, Ki, MTsat and normalized volume) jointly.
Hippocampus
Given the high prevalence of hippocampal involvement in neurodegenerative dementia, we performed a more detailed analysis of the hippocampus by characterizing measurements at the subfield level Karat et al., 2024. We used HippUnfold (version 2.2.0) DeKraker et al., 2022DeKraker et al., 2026 with the model trained on data from people with AD (ADNI_T1w_v1) Karat et al., 2025 for hippocampal surface generation and subfield delineation. We used the T1w modality with the default parameters. We manually inspected all hippocampal segmentations and surfaces for quality assessment, which resulted in the exclusion of seven participants (2 AD, 4 FTD and 1 LBD) due to artifacts in the hippocampal subfield segmentations. We excluded these participants from both the whole brain and hippocampus analyses, so that all analyses used the same sample.
We then sampled all T1w-registered metric maps onto the hippocampal surface vertices with Connectome Workbench (version 2.1.0, https://
Statistical analysis
For the whole brain analyses, we performed an analysis of covariance (ANCOVA) for each ROI-metric combination to compare groups while controlling for age and sex. We checked the homogeneity of regression slopes, normality of residuals, and homogeneity of variance to confirm the validity of the ANCOVA model. When the homogeneity of regression slopes assumption was not met, we fitted a model that included the interaction between group and the violating covariate. We visually inspected violations of residual normality using Q-Q plots.
Each model compared the four diagnostic groups for one metric and ROI. We used partial omega squared () as the primary effect size measure, as it provides a bias-corrected estimate of variance explained, which is preferable to partial eta squared () for limited sample sizes Kroes & Finley, 2025. Finally, we corrected for multiple comparisons with the Benjamini–Yekutieli false discovery rate (FDR) procedure (α = 0.05), which controls the FDR under arbitrary dependence between tests, as expected for correlated metrics and ROIs.
We applied the same ANCOVA model, controlling for age and sex, to the MhD of each ROI. The MhD is non-negative and right-skewed: for multivariate normal data, the squared MhD follows a χ2 distribution. In addition, participants with dementia are expected to have larger and more variable distances than HC. We therefore log-transformed the MhD before the ANCOVA to reduce skewness and stabilize its variance across groups, and checked the ANCOVA assumptions on the transformed values.
For ROI-metric combinations that survived FDR correction (p<0.05), we performed exploratory post-hoc pairwise group comparisons with age- and sex-adjusted estimated marginal means derived from the ANCOVA models. We treated the six pairwise contrasts (AD-HC, AD-FTD, ...) as the comparison family and applied the Holm correction within it. We reported partial Hedges’ g (g’) as the primary effect size measure, as it provides a bias-corrected version of partial Cohen’s d that is preferable for limited sample sizes.
For the hippocampal subfield analysis, we performed ANCOVAs controlling for age, sex and hemisphere for each metric and subfield combination. We included the surface-based metrics provided by HippUnfold in the ANCOVA analysis. Finally, we calculated for effect size measurement and applied the same FDR correction for multiple comparisons.
We performed the analyses in Python (version 3.12.15) with pandas (3.0.6), NumPy (2.5.3), SciPy (1.18.1) and statsmodels (0.14.6), and in R (version 4.5.3), called through rpy2 (3.6.8), using car (3.1-5) for the ANCOVAs and assumption tests, effectsize (1.0.3) for the effect sizes, and marginaleffects (0.32.0) for the post-hoc comparisons. We created the figures with plotly (6.9.0), seaborn (0.13.2) and matplotlib (3.11.2), and the demographics table with tableone (0.9.6).
Results
Participants
A total of 57 participants met the inclusion and exclusion criteria and completed the MRI protocol (16 AD, 17 FTD, 11 LBD and 13 HC). After excluding seven participants at segmentation quality control (2 AD, 4 FTD and 1 LBD; see Methods), 50 participants were included in the analyses: 14 AD, 13 FTD (7 behavioral variant FTD, 4 primary progressive aphasia FTD and 2 corticobasal syndrome), 10 LBD and 13 HC (Figure 1 and Table 1). MTsat data were not collected for four participants whose scanning session ended before the MTsat acquisition (three of them in the analyzed sample), leaving 47 participants for the MTsat analyses.
Table 1:Demographics and clinical characteristics of the participants included in the analyses (n = 50).
Figure 1:Summary of age, sex and group distributions of the participants included in the analyses (n = 50). Groups: Alzheimer’s disease (AD), Lewy body dementia (LBD), frontotemporal dementia (FTD).
Whole brain analysis
Figure 2 shows example quantitative MRI maps and ROIs from a participant in the AD group.
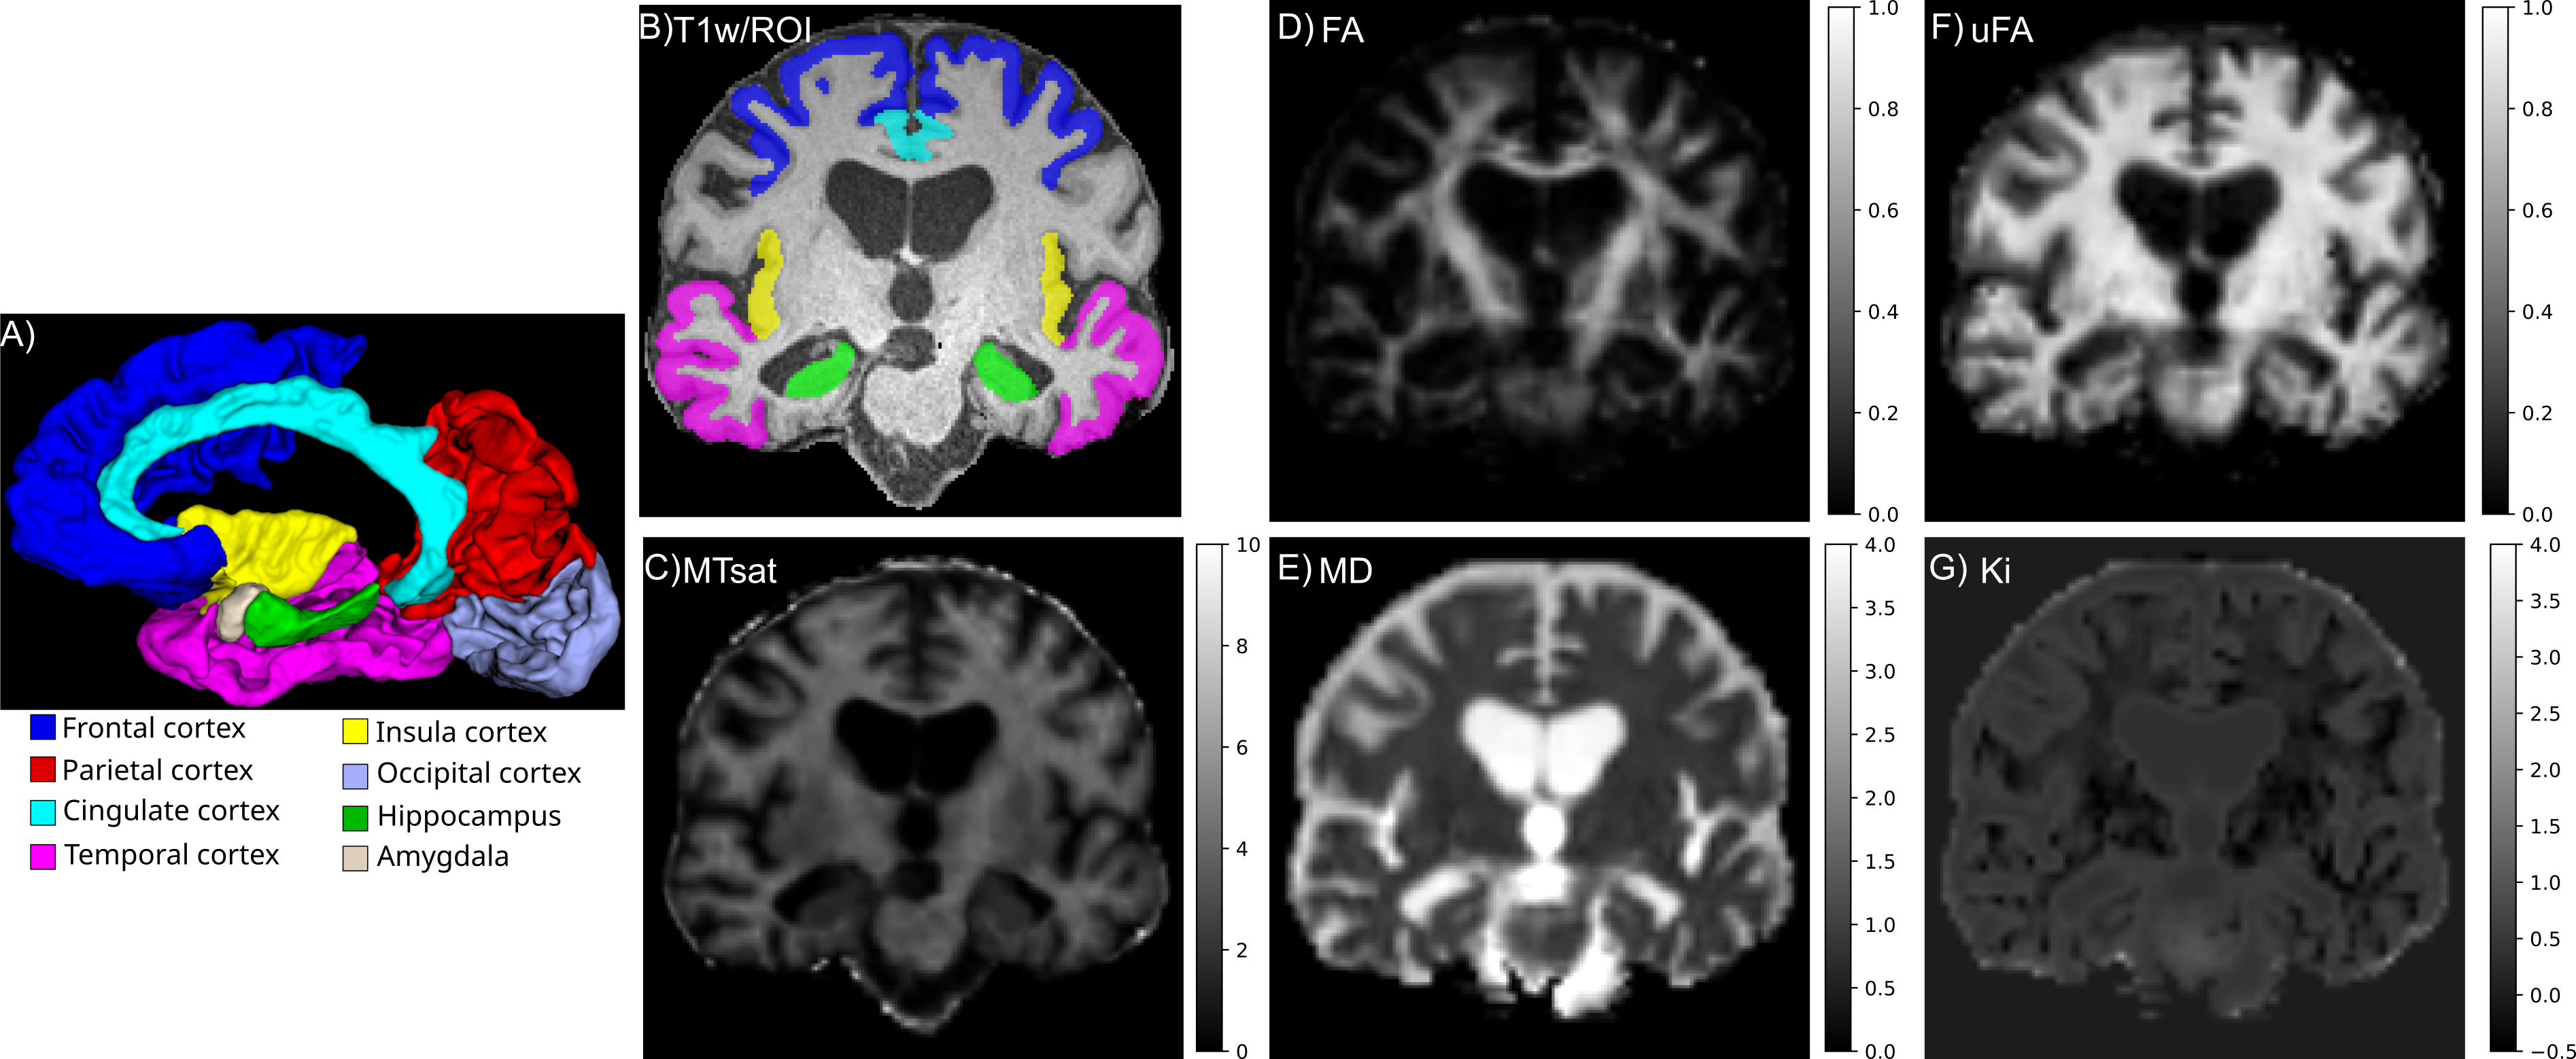
Figure 2:Representative quantitative MRI maps and ROIs of a participant with AD. A) 3D visualization of segmented brain structures. B) ROIs shown over an anatomical T1w image. C) Magnetization transfer saturation (MTsat). D) Fractional anisotropy (FA). E) Mean diffusivity (MD). F) Microscopic fractional anisotropy (µFA). G) Isotropic kurtosis (Ki).
To capture the differences between the dementia groups and HC in the multidimensional metric space, we combined the metrics into a single MhD per ROI (Figure 3). For the log-transformed MhD, the largest effect sizes () were observed in cortical ROIs: temporal [F(3,41)=35.76, p=3.5×10⁻¹⁰, =0.70], frontal [F(3,41)=18.58, p=9.9×10⁻⁷, =0.55] and parietal [F(3,41)=17.83, p=1.1×10⁻⁶, =0.54] (Supplementary Table S.1). Supplementary Figure S.2 shows the MhD as a function of age.
Figure 3:Box plots of the Mahalanobis distance (MhD) of each participant from the distribution of the control group, calculated from the quantitative MRI metrics for each ROI.
Volume, µFA and MTsat generally trended lower in all ROIs in participants with dementia compared to HC, while MD trended higher (Figure 4).
Figure 4:Box plots of the quantitative MRI metrics and normalized volumes (select with the dropdown menu) in each ROI for the four groups.
Group effects that survived FDR correction were found broadly throughout the brain for MD (Table 2), where the largest effect sizes () were observed in cortical ROIs: temporal [F(3,44)=13.71, p=0.0004, =0.46], frontal [F(3,41)=9.92, p=0.0035, =0.35], cingulate [F(3,41)=8.30, p=0.0085, =0.34] and insula [F(3,44)=7.89, p=0.0091, =0.32], while µFA had the largest effect in the hippocampus [F(3,44)=7.47, p=0.0102, =0.34]. MTsat had a large effect in the amygdala [F(3,41)=6.24, p=0.0374, =0.36] and hippocampus [F(3,41)=5.90, p=0.0316, =0.34]. Normalized volume had a large effect in the temporal [F(3,44)=10.80, p=0.0021, =0.38] and parietal [F(3,44)=9.05, p=0.0047, =0.33] ROIs.
The assumption of homogeneity of regression slopes was not met for 14 ROI-metric combinations (13 with a group × age and one with a group × sex interaction, p < 0.05), indicating differential covariate-metric relationships across groups. We therefore refit these models with the interaction term and evaluated only the group effect. Five of the combinations that survived FDR correction came from refitted models (Cingulate-MD, Frontal-MD, Frontal-µFA, Temporal-µFA and Temporal-Ki). Ki showed a group effect only in the temporal cortex, from the refitted model [F(3,41)=6.46, p=0.0262, =0.25]. Supplementary Table S.2 lists all combinations that did not meet the ANCOVA assumptions before FDR correction.
Table 2:ANCOVA results
ANCOVA results (group effect, with age and sex as covariates) for the ROI-metric combinations that survived FDR correction. Effect sizes are partial omega squared (); the upper bounds of the confidence intervals were 1.0 in all cases, so only the lower bounds are reported. p-values are FDR-corrected.
In the exploratory post-hoc analysis (Figure 5), almost all ROI-metric combinations differentiated AD from HC (17 of 18) and FTD from HC (15 of 18), whereas LBD differed from HC only in parietal MD. Between dementias, AD differed from LBD in most combinations (13 of 18), most often in the temporal cortex and hippocampus, and FTD differed from LBD mainly in temporal metrics (MD, µFA, Ki and normalized volume), with additional differences in frontal and hippocampal µFA. AD and FTD differed only in cingulate FA and hippocampal MTsat. Supplementary Table S.3 lists the full post-hoc results.
Figure 5:Partial Hedges’ g for the pairwise group contrasts of the exploratory post-hoc analysis, based on age- and sex-adjusted estimated marginal means from the ANCOVA models. Blue and red indicate lower and higher values, respectively, in the first group of each contrast. ROI-metric combinations that did not survive FDR correction in the ANCOVA are not shown, and blank cells are contrasts that did not survive Holm correction. The columns with the most entries (AD-HC, FTD-HC and AD-LBD) are the best-differentiated group pairs, with some differentiation between FTD and LBD and little between LBD and HC or between AD and FTD. The rows with the most entries are the ROI-metric combinations with the best overall differentiation.
Hippocampal analysis
Figure 6 shows the segmented hippocampus and the corresponding µFA map for an HC participant and a participant with AD; the participant with AD shows qualitatively enlarged ventricles and hippocampal atrophy. The metrics sampled over the whole hippocampus in the HippUnfold surface space recapitulated the findings from the whole-brain hybrid segmentation (Supplementary Figure S.3). With age, MD tended to increase while volume, MTsat and µFA decreased in all groups (Supplementary Figure S.4).
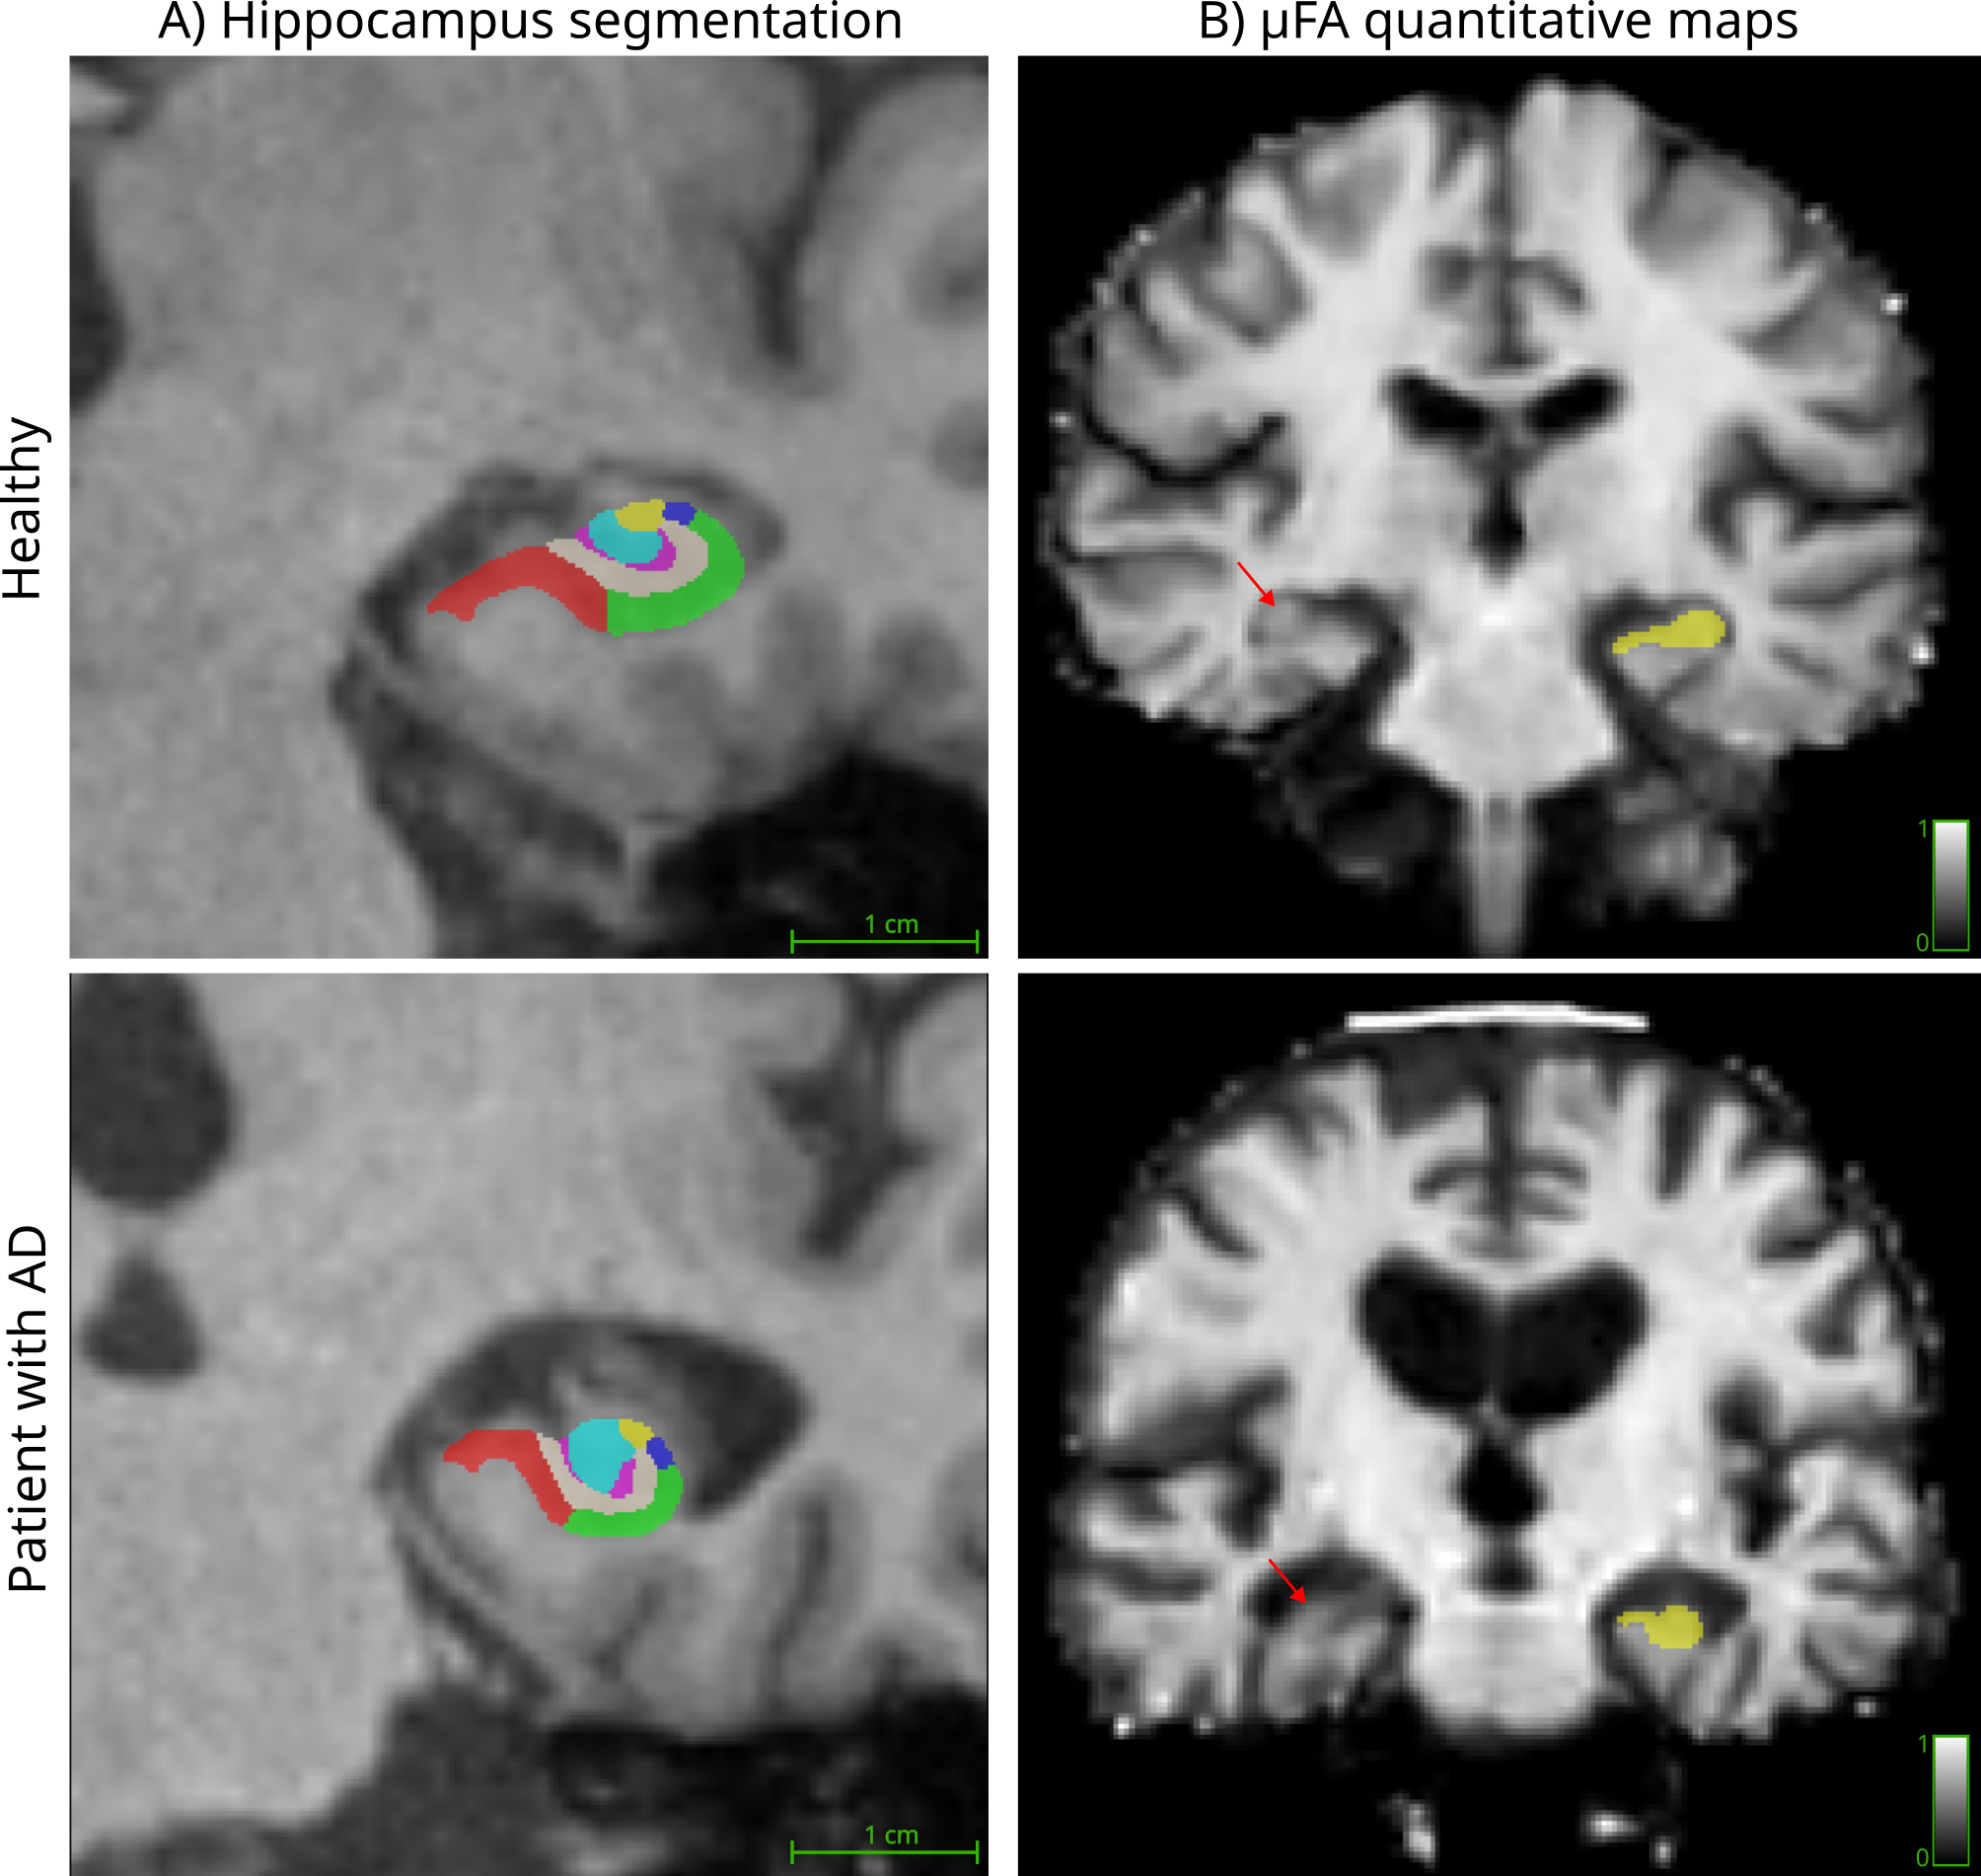
Figure 6:A) Segmented hippocampus and its subfields over an anatomical T1w image. B) Microscopic fractional anisotropy (µFA) maps with the hippocampus ROI. Rows show representative examples of a healthy control and a participant with AD. Lower µFA can be qualitatively observed in the participant with AD (arrows).
At the subfield level, µFA and MD showed less overlap between groups, with the clearest separation between the AD and HC groups, and the quantitative MRI metric changes were distributed throughout the hippocampus (Figure 7). µFA and MD had consistently large effects through the hippocampal subfields ( > 0.2; Table 3). MD had its largest effects in DG [F(3,93)=17.25, p=7.8×10⁻⁷, =0.35] and CA3 [F(3,93)=16.64, p=8.1×10⁻⁷, =0.34], while µFA had its largest effects in CA2 [F(3,93)=17.11, p=7.8×10⁻⁷, =0.34] and subiculum [F(3,93)=15.36, p=1.7×10⁻⁶, =0.33]. Among the HippUnfold surface-based metrics, only CA1 curvature and subiculum gyrification differed between groups, with small effects ( = 0.13 and 0.08; Supplementary Figure S.5).
Figure 7:Line plots of the quantitative MRI metrics (select with the dropdown menu) across the hippocampal subfields for each group. The solid line represents the mean, and the shaded region denotes the 95% confidence interval of the mean (mean ± 1.96 × standard error), computed over both hemispheres of all participants in each group. Metrics: normalized volume, fractional anisotropy (FA), mean diffusivity (MD), microscopic fractional anisotropy (µFA), isotropic kurtosis (Ki) and magnetization transfer saturation (MTsat). Subfields: subiculum (Sub), cornu ammonis fields 1–4 (CA1–CA4) and dentate gyrus (DG). Groups: Alzheimer’s disease (AD), Lewy body dementia (LBD), frontotemporal dementia (FTD).
Table 3:Hippocampus ANCOVA results
ANCOVA results (group effect, with age, sex and hemisphere as covariates) for the subfield-metric combinations that survived FDR correction. Effect sizes are partial omega squared (); the upper bounds of the confidence intervals were 1.0 in all cases, so only the lower bounds are reported. p-values are FDR-corrected.
Discussion
This study examined the ability of advanced diffusion and magnetization transfer metrics to stratify different types of dementia. We focused on eight gray matter regions differentially affected across AD, FTD, and LBD, including the hippocampus (a key region in AD that is also affected in FTD), using state-of-the-art segmentation tools. The b-tensor encoding metrics used here (µFA, Ki) complement standard DTI metrics, as µFA is insensitive to orientation dispersion and Ki is sensitive to tissue heterogeneity. µFA is thought to be sensitive to neurite density Lampinen et al., 2023, and recent work has shown that it is relatively insensitive to myelination changes in mice Rahman et al., 2025. In contrast, MTsat is highly correlated with myelin content Helms et al., 2008Wood & Malik, 2020. µFA and MTsat thus provide complementary measures of axon integrity and myelination. Furthermore, Ki measures the variance of compartment diffusivities, which is thought to correlate with tissue heterogeneity. Combining these metrics with the MhD provides a more comprehensive quantification of microstructural neurodegeneration across dementias, and could help disentangle the different sources of microstructural change in dementia.
We explored the MhD as a tool to capture the overall dementia-related changes in the multidimensional metric space. All dementia groups showed higher MhD than HC. The frontal and temporal cortices showed distinct MhD profiles for each dementia group, with LBD most similar to HC, followed by FTD, and then AD (highest MhD). These metrics are expected to change with normal aging Chen et al., 2024Kim et al., 2026Kamiya et al., 2020, which is in line with the overall trend in the MhD space for the HC and dementia groups. These results encourage further multivariate analyses of this metric space across dementias. Machine learning algorithms, which excel at handling multivariate spaces, could capture finer details of this space to further stratify dementia; we did not pursue this approach because these algorithms require large amounts of training data, which remain scarce.
MD had the largest effect sizes in the temporal, frontal, cingulate and insular cortices, while µFA had the largest effect in the hippocampus, and MTsat in both the hippocampus and amygdala. Increased cortical MD has been reported in AD, with changes that are detectable independently of cortical thinning Montal et al., 2018Spotorno et al., 2024. These changes reflect the loss of microstructure in these regions and align with the expected neurodegeneration of the hippocampus in AD and of the frontal and temporal cortices in FTD.
The metrics clearly separated AD and FTD from HC, and AD from LBD, but separated LBD from HC and AD from FTD poorly. The LBD group showed higher MhD than HC but barely differed from HC in the post-hoc analysis (only parietal MD). However, the LBD group had a narrower age distribution than the other groups, which may affect the age adjustment in our models. The low separability between LBD and HC is consistent with the limited cortical atrophy reported in dementia with Lewy bodies Whitwell et al., 2007.
The AD group showed the most severe neurodegeneration for most ROIs in this cohort. This was also visible in the MhD, with the AD group having the largest distances from HC, and in the post-hoc analysis, where AD had the largest effect sizes. Overall, microstructural integrity followed a consistent order across groups, from highest to lowest: HC > LBD >> FTD > AD. Our findings further suggest that the temporal cortex is a strong candidate to capture this gradient. Interestingly, we observed the same ordering in the participants’ MoCA scores (Table 1), suggesting the microstructural changes measured by these metrics may reflect overall cognitive decline.
We also observed changes in MTsat, suggesting demyelination in several ROIs. This aligns with recent reports that MTsat of the hippocampus decreases with age in people with AD Wearn et al., 2025. Further research is required to determine how demyelination differs across dementias. Advanced techniques such as inhomogeneous magnetization transfer Varma et al., 2015 improve myelin specificity and are a viable option for future studies. Ki was higher in the dementia groups, but with smaller effect sizes than MD and µFA, and only in the temporal cortex. The high within-group variance of Ki may partly explain its lower sensitivity. Recent research suggests that Ki could be affected by multiple sub-kurtosis sources Henriques et al., 2021Novello et al., 2022, such as exchange and diffusion time dependence, which were not accounted for in this study.
Interestingly, µFA decreased in all subfields, which suggests a broad loss of axons. Given the well-characterized cell loss of the subiculum and CA1 in AD Ashford et al., 2011Karat et al., 2024, this may suggest that axons that project from upstream regions of the trisynaptic circuit (e.g., DG and CA3) are compromised when their targets in CA1 and the subiculum are lost. Hippocampal µFA reductions have also been reported in temporal lobe epilepsy, where they were localized to the CA4/DG region affected by hippocampal sclerosis and outperformed volume in detecting pathology Arezza et al., 2024. Although the underlying pathology differs from that of neurodegenerative dementia, this supports µFA as a sensitive marker of hippocampal neuronal loss that complements volumetry. MD is sensitive to these changes, but the underlying microstructural properties remain unclear Karat et al., 2024, and µFA could help disentangle them as a complementary measure.
µFA and MTsat both showed decreasing trends with age in the hippocampus (Supplementary Figure S.4) and appeared to decline more steeply in participants with dementia, particularly AD, which may suggest decreasing axonal content during normal aging that is accelerated with dementia. Others have reported decreasing µFA with healthy aging Kamiya et al., 2020Andersen et al., 2020, and a similar pattern for MTsat Wearn et al., 2025. While the natural progression of aging affects these metrics, dementia subtypes may accelerate the measured degenerative process. This study treated age as a covariate, but further research with larger numbers of participants is required to determine whether and how aging interacts with or drives structural neurodegeneration in dementia.
Other studies have used biophysical models Novikov et al., 2018 to characterize these dementias. Some studies rely on the neurite orientation dispersion and density imaging (NODDI) model Zhang et al., 2012 and report the sensitivity of its metrics to AD and FTD Veale et al., 2021Lv et al., 2025Pisano et al., 2025. Other modeling approaches, such as the recently developed soma and neurite density imaging (SANDI) model Palombo et al., 2020, are tailored for gray matter cellular microstructure. Recent studies with high-gradient systems have reported SANDI metrics in aging brain structures Lee et al., 2024Ma et al., 2026, providing evidence that these metrics could be sensitive to neurodegenerative microstructural changes in AD and FTD. However, biophysical models rely on tissue assumptions that may need additional validation in these dementia types Jelescu et al., 2020. Characterization of AD, FTD, and LBD with advanced representation metrics, including µFA, which had considerable effect sizes in this study, could provide complementary information to further improve biophysical modeling aimed at diagnosing dementia. This is especially relevant for b-tensor encoding acquisitions, which could relax model assumptions and yield more specific microstructural metrics Lampinen et al., 2020Gyori et al., 2021.
Multiple limitations should be considered. First, the analysis was performed on a small dataset, which may limit generalizability beyond our cohort and increases the chance of false negatives due to low statistical power. Nevertheless, the main effects were large enough to be detected even in this small cohort. Second, the LBD group was not properly age-matched to the other groups, and changes produced by healthy aging could be a confounding factor in its analysis when compared to the HC group Ma et al., 2026. This could partially explain why, when correcting for age, this group barely differed from HC (only parietal MD). Third, the segmentation tools could not delineate the ROIs properly for some participants, which reduced our sample and may have biased our results toward participants with less severe neurodegeneration. This may explain why hippocampal volume did not differ between groups after FDR correction. SIAM, SynthSeg+, and HippUnfold (default model) use machine learning algorithms that were trained on data from healthy individuals and still struggle in brains with ongoing neurodegeneration. Hippocampal segmentations improved when we used HippUnfold with the AD model Karat et al., 2025, suggesting that these tools could improve as more high-resolution dementia datasets become available. Even in these participants with less severe volume loss, we observed large reductions in µFA in the hippocampus. Fourth, the voxel size of the MRI images is relatively large for microstructural studies, especially for hippocampal subfields, and partial volume effects may be affecting the current study. Free water elimination techniques for b-tensor encoding Arezza et al., 2023 could reduce partial volume effects from the ventricles. However, they require additional encoding shells at low b-values which were not acquired in this study. Fifth, our ROIs combined lobes across both hemispheres, which may average out sub-regional and lateralized patterns, especially for FTD subgroups, which we were not able to explore given our sample size. Finally, recent research has shown that b-tensor-derived metrics could be biased by diffusion time dependence arising from the spectral content of the waveforms Lasič et al., 2025Szczepankiewicz et al., 2026. The b-tensor acquisition scheme used here is susceptible to this effect, and the metrics derived could present this bias. Future b-tensor encoding dementia studies should account for this bias as time dependence effects are present in gray matter regions Olesen et al., 2022Jelescu et al., 2022.
These results also motivate several avenues for future work. The relationship between the b-tensor encoding metrics (µFA and Ki) and the hallmark misfolded proteins of each dementia type, including TDP-43 and tau in FTD, amyloid-β in AD and α-synuclein in LBD, is currently unknown and should be examined. Recent research has shown links between standard dMRI metrics and α-synuclein Mak et al., 2026 and between MTsat and tau and amyloid-β deposits Moallemian et al., 2023Wearn et al., 2025, which could benefit from the additional information contained in b-tensor encoding metrics as presented in this work. Future studies with larger samples should also examine differences in µFA and Ki outcomes per FTD subtype, particularly the behavioral and semantic variants, the most common subtypes, as they affect distinctly different brain regions Finger, 2016Gordon et al., 2016. Overall, µFA provided information complementary to the widely used standard DTI and volumetric metrics, which could improve our understanding of the spatiotemporal progression of neurodegenerative dementia.
Conclusion
In this study, we showed how advanced dMRI metrics and MTsat varied across brain regions in AD, FTD, and LBD compared with healthy controls. Probing the multivariate space of these metrics with MhD showed promise for differentiating between dementia types. We identified the combinations of metrics and ROIs that best differentiated the groups. In the hippocampus, µFA patterns varied across dementia types, making it a potential marker of hippocampal degeneration that could complement standard metrics for dementia stratification.
Declaration of the use of AI
AI was not used to design the study, process the MRI data, choose the statistical methods, interpret the results, or write the original draft. We used Claude Code (Anthropic; Claude Opus 5.5 model) to assist with parts of the analysis and plotting code (refactoring between R and Python, helper functions, and code for the interactive and static figures), to check spelling and grammar, and to assist with editing parts of the text. It also assisted with reviewing the literature on the regional vulnerability of each dementia that supports the choice of ROIs (Methods, Whole brain analysis); all citations in that section were checked by the authors against the cited sources. The authors reviewed and verified all AI-assisted code and text.
Competing interests
The authors declare no competing interests.
Acknowledgments
The authors are grateful to Jake Hamilton for insightful discussions and feedback. This work was supported by Canada Research Chairs (950–231 993) and the Canada First Research Excellence Fund to BrainsCAN.
Data Availability
Raw data and derivatives are structured into the BIDS format Gorgolewski et al., 2016 in compliance with the qMRI-BIDS extension Karakuzu et al., 2022. We added an additional metadata file (not part of the BIDS standard) describing the b-tensor encoding acquisition (the bshape file) to be able to identify the shape of the b-tensor used in the study. Pre-processed deidentified data (denoised and brain-extracted) and derivatives (quantitative MRI maps) will be made openly available in the Federated Research Data Repository (FRDR) at the time of journal publication.
The complete preprocessing, processing and dataframes creation pipelines are shared through a Snakemake workflow (version 9.21.1) Mölder et al., 2025 for an open and reproducible workflow. The Snakemake project, software requirements and instructions are available at github
All ROI-level data (archived on Zenodo Rios-Carrillo et al., 2026), along with the analysis and visualization code (Jupyter notebooks), are openly available in this living preprint; its source repository is github
- Breijyeh, Z., & Karaman, R. (2020). Comprehensive Review on Alzheimer’s Disease: Causes and Treatment. Molecules, 25(24), 5789. 10.3390/molecules25245789
- Weston, P. S. J., Simpson, I. J. A., Ryan, N. S., Ourselin, S., & Fox, N. C. (2015). Diffusion imaging changes in grey matter in Alzheimer’s disease: a potential marker of early neurodegeneration. Alzheimer’s Research & Therapy, 7(1), 47. 10.1186/s13195-015-0132-3
- Jack, C. R., Knopman, D. S., Jagust, W. J., Shaw, L. M., Aisen, P. S., Weiner, M. W., Petersen, R. C., & Trojanowski, J. Q. (2010). Hypothetical model of dynamic biomarkers of the Alzheimer’s pathological cascade. The Lancet Neurology, 9(1), 119–128. 10.1016/S1474-4422(09)70299-6
- Serrano-Pozo, A., Frosch, M. P., Masliah, E., & Hyman, B. T. (2011). Neuropathological Alterations in Alzheimer Disease. Cold Spring Harbor Perspectives in Medicine, 1(1), a006189. 10.1101/cshperspect.a006189
- Mackenzie, I. R. A., & Neumann, M. (2016). Molecular neuropathology of frontotemporal dementia: insights into disease mechanisms from postmortem studies. Journal of Neurochemistry, 138(S1), 54–70. 10.1111/jnc.13588
- Sekiya, H., Matsubara, T., DeTure, M. A., & Dickson, D. W. (2025). Neuropathology of Lewy body dementia: Lewy-related pathology, α-synuclein oligomers, and comorbid pathologies. Molecular Neurodegeneration, 20(1), 117. 10.1186/s13024-025-00900-6
- Zetterberg, H., & Bendlin, B. B. (2026). Biofluid biomarkers in Alzheimer’s disease and other neurodegenerative dementias. Nature, 650(8100), 49–59. 10.1038/s41586-025-10018-w
- Le Bihan, D., Breton, E., Lallemand, D., Grenier, P., Cabanis, E., & Laval-Jeantet, M. (1986). MR imaging of intravoxel incoherent motions: application to diffusion and perfusion in neurologic disorders. Radiology, 161(2), 401–407. 10.1148/radiology.161.2.3763909
- Beaulieu, C. (2002). The basis of anisotropic water diffusion in the nervous system – a technical review. NMR in Biomedicine, 15(7–8), 435–455. 10.1002/nbm.782
- Afzali, M., Pieciak, T., Newman, S., Garyfallidis, E., Özarslan, E., Cheng, H., & Jones, D. K. (2021). The sensitivity of diffusion MRI to microstructural properties and experimental factors. Journal of Neuroscience Methods, 347, 108951. 10.1016/j.jneumeth.2020.108951
- Concha, L. (2014). A macroscopic view of microstructure: Using diffusion-weighted images to infer damage, repair, and plasticity of white matter. Neuroscience, 276, 14–28. 10.1016/j.neuroscience.2013.09.004
- Drake-Pérez, M., Boto, J., Fitsiori, A., Lovblad, K., & Vargas, M. I. (2018). Clinical applications of diffusion weighted imaging in neuroradiology. Insights into Imaging, 9(4), 535–547. 10.1007/s13244-018-0624-3
- Basser, P. J., Mattiello, J., & Lebihan, D. (1994). Estimation of the Effective Self-Diffusion Tensor from the NMR Spin Echo. Journal of Magnetic Resonance, Series B, 103(3), 247–254. 10.1006/jmrb.1994.1037
- Chen, Y., Wang, Y., Song, Z., Fan, Y., Gao, T., & Tang, X. (2023). Abnormal white matter changes in Alzheimer’s disease based on diffusion tensor imaging: A systematic review. Ageing Research Reviews, 87, 101911. 10.1016/j.arr.2023.101911
- Acosta-Cabronero, J., & Nestor, P. J. (2014). Diffusion tensor imaging in Alzheimer’s disease: insights into the limbic-diencephalic network and methodological considerations. Frontiers in Aging Neuroscience, 6, 266. 10.3389/fnagi.2014.00266